Charts / Area
Area
Rendered from sample rows by viz_render in OODS Foundry 0.10.1, in each theme.
Generated from @oods/foundry 0.10.1
Each chart is drawn live in your browser from the spec viz_render returned with it, so you can point at its marks. The SVG viz_render returned is the record: its hash is under each chart, and it shows where a live drawing would differ from it.
pattern:viz:layered-line-area
sha256:48809474123f… drawn live from its spec 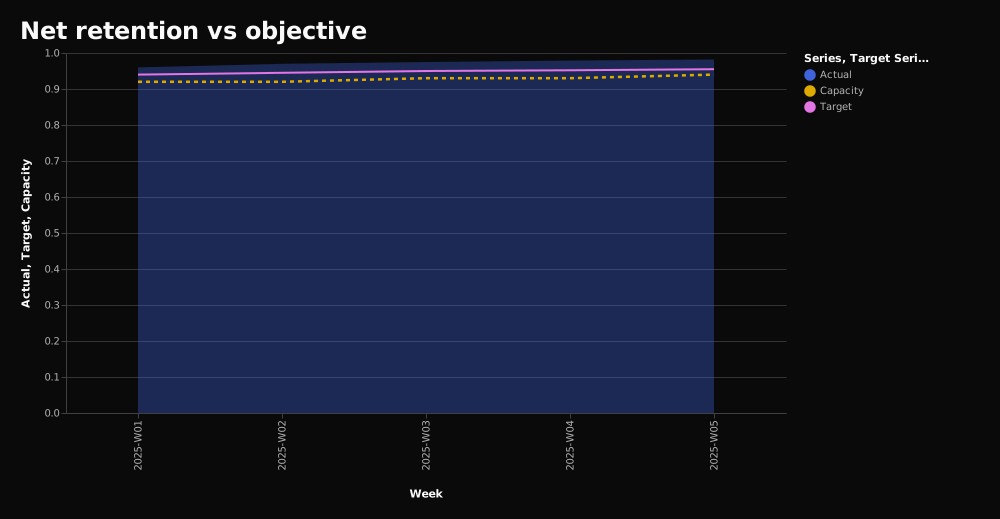
sha256:bce308c3a8e5… drawn live from its spec 
sha256:dcb9db844eaa… drawn live from its spec pattern:viz:running-total-area
sha256:3765719af3af… drawn live from its spec 
sha256:8ae59a044bd0… drawn live from its spec 
sha256:5a988eaae344… drawn live from its spec pattern:viz:stacked-area-projection
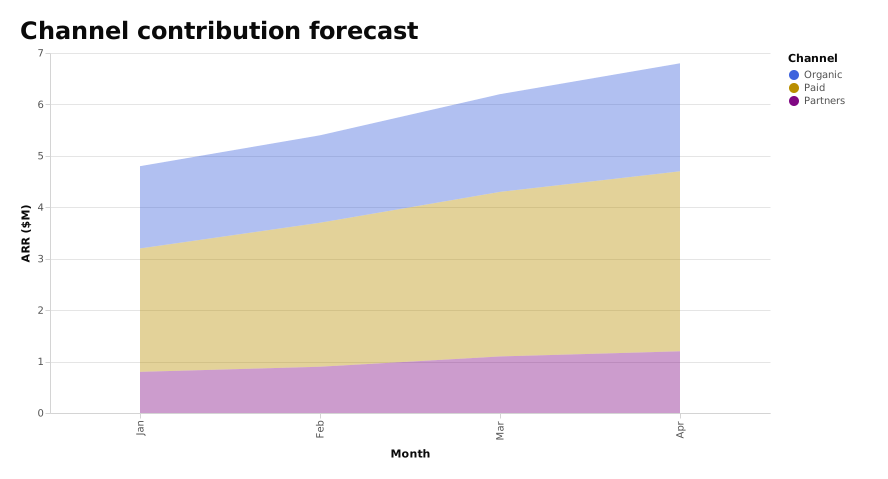
sha256:16461c5a9264… drawn live from its spec 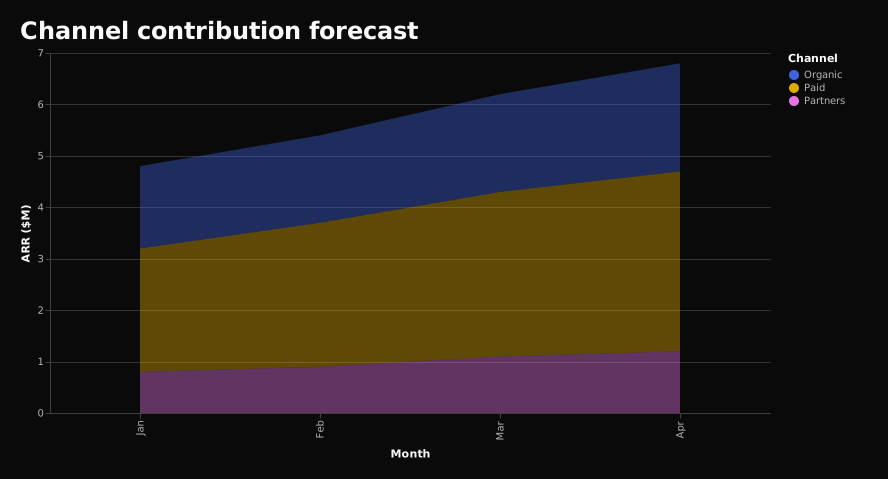
sha256:a9f12c3b6be8… drawn live from its spec 
sha256:cd34fe7054fe… drawn live from its spec Certified: 4 results
artifact_certify on layered-line-area, drawn in light: coverage certified, conformant
true.
- accessibility equivalence
a11yEquivalence -
pass - determinism
determinism -
pass - contrast
contrast -
pass - accuracy
accuracy -
pass
Contrast: certify grades the series-to-paint assignment of the rendered chart (the compiled spec rendered through @oods/viz-render), against the requested CSS scope canvas. Scope: light/A.
Its narrative
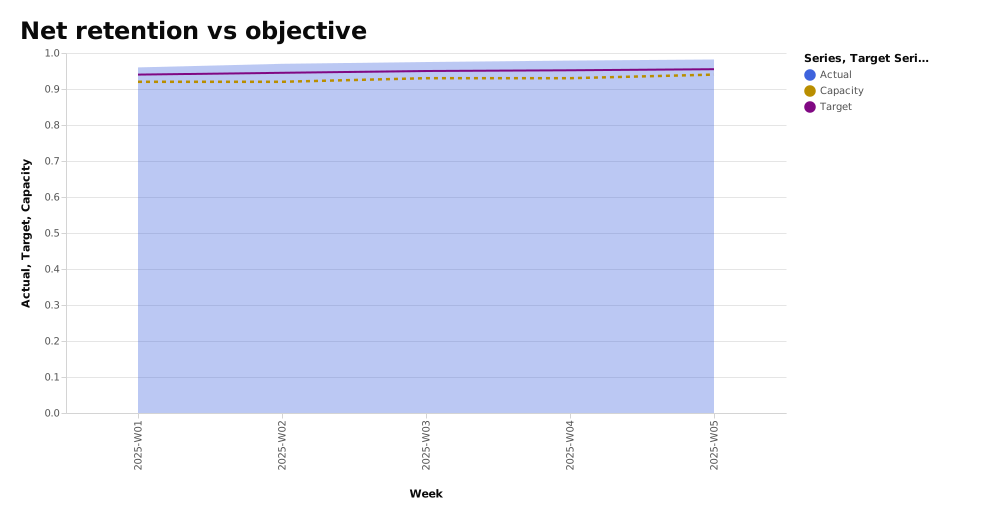
Actual retention remains above both target and capacity thresholds for five consecutive weeks
- High Actual: Actual 0.98 (2025-W05)
- Low Actual: Actual 0.96 (2025-W01)
- Trend increasing: 2.3%
- Actual Series: Actual
Its data table
| Week | Actual | Target | Capacity | Actual Series | Target Series | Capacity Series |
|---|---|---|---|---|---|---|
| 2025-W01 | 0.96 | 0.94 | 0.92 | Actual | Target | Capacity |
| 2025-W02 | 0.97 | 0.95 | 0.92 | Actual | Target | Capacity |
| 2025-W03 | 0.98 | 0.95 | 0.93 | Actual | Target | Capacity |
| 2025-W04 | 0.98 | 0.95 | 0.93 | Actual | Target | Capacity |
| 2025-W05 | 0.98 | 0.96 | 0.94 | Actual | Target | Capacity |
Certification covers charts only: it measures the chart's specification. A pass means no offered rule found a problem, not a general promise. An ECharts type certifies only when its data is supplied.
The call
{
  "brand": "A",
  "theme": "light",
  "spec": { … the normalized spec viz_render returned … }
}