Charts / Chord
Chord
Rendered by viz_render in OODS Foundry 0.10.1, in each theme, from sample data this site supplies.
Generated from @oods/foundry 0.10.1
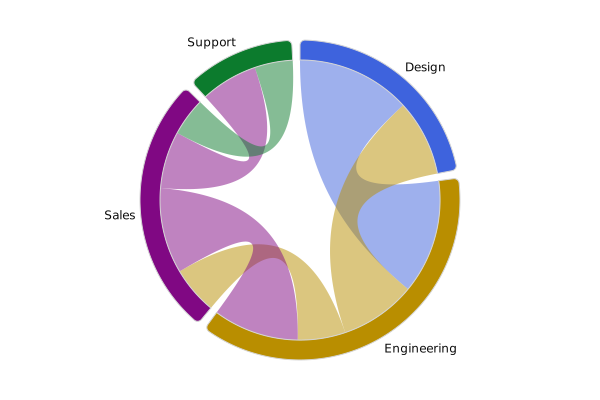
No named pattern draws this type, so this site supplies the data: Requests between teams in a week (made up).
Each chart is drawn live in your browser from the spec viz_render returned with it, so you can point at its marks. The SVG viz_render returned is the record: its hash is under each chart, and it shows where a live drawing would differ from it.
chord
sha256:6f94777bc535… drawn live from its spec 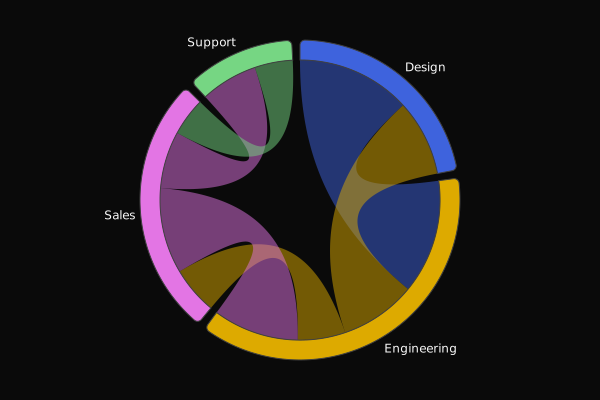
sha256:ebcd337c5a04… drawn live from its spec 
sha256:7fd40d937c8e… drawn live from its spec Certified: 4 results
artifact_certify on chord, drawn in light: coverage certified, conformant
true.
- accessibility equivalence
a11yEquivalence -
pass - determinism
determinism -
pass - contrast
contrast -
pass - accuracy
accuracy -
pass
Findings
-
OODS-A11Y-R-14(warn) Set portability.tableColumnOrder when rendering tables with more than two columns.
Contrast: Contrast was graded from the actual rendered ECharts carrier geometry and semantic assignment. certify grades actual carrier paints extracted from the normalized SVG rendered from the retained projected ECharts option against the requested CSS scope canvas. Scope: light/A.
Its narrative
Chord diagram covers 6 data points totaling 44 Flow.
- High Flow: Flow 12 (Design → Engineering)
- Low Flow: Flow 4 (Support → Sales)
- Total Flow: 44
Its data table
| Source | Target | Value |
|---|---|---|
| Design | Engineering | 12 |
| Engineering | Design | 8 |
| Engineering | Sales | 5 |
| Sales | Engineering | 9 |
| Sales | Support | 6 |
| Support | Sales | 4 |
Certification covers charts only: it measures the chart's specification. A pass means no offered rule found a problem, not a general promise. An ECharts type certifies only when its data is supplied.
The call
{
  "brand": "A",
  "theme": "light",
  "spec": { … the normalized spec viz_render returned … },
  "data": { … the same data it drew … }
}