Charts / Flow map
Flow map
Rendered by viz_render in OODS Foundry 0.10.1, in each theme, from sample data this site supplies.
Generated from @oods/foundry 0.10.1
No named pattern draws this type, so this site supplies the data: Crates shipped between the same made-up towns.
Each chart is drawn live in your browser from the spec viz_render returned with it, so you can point at its marks. The SVG viz_render returned is the record: its hash is under each chart, and it shows where a live drawing would differ from it.
flow_map
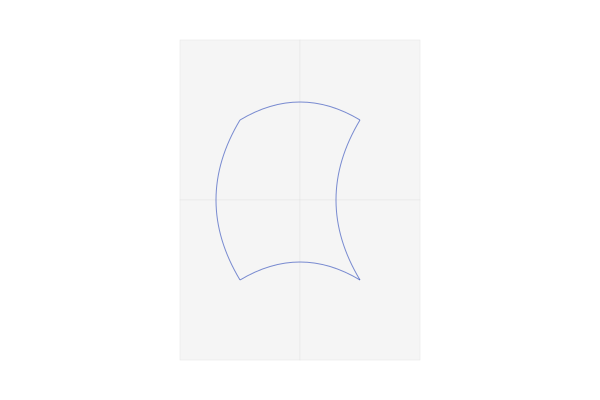
sha256:00313f4ee2fc… drawn live from its spec 
sha256:048683f6881e… drawn live from its spec 
sha256:ae262750aec1… drawn live from its spec Certified: 4 results
artifact_certify on flow_map, drawn in light: coverage certified, conformant
true.
- accessibility equivalence
a11yEquivalence -
pass - determinism
determinism -
pass - contrast
contrast -
exempt - accuracy
accuracy -
pass
Findings
-
OODS-A11Y-R-14(warn) Set portability.tableColumnOrder when rendering tables with more than two columns.
Contrast: Geo carrier paints were read from the rendered ECharts SVG, but geo color remains exempt from categorical contrast grading under the standing gradient-essential ruling. certify reads actual carrier paints from the normalized SVG rendered from the retained projected ECharts option. Geo categorical contrast remains exempt, so no canvas ratio is graded. Scope: light/A.
Its narrative
Flow map covers 4 data points totaling 70 crates.
- High crates: crates 30 (Feature 1)
- Low crates: crates 8 (Feature 4)
- Total crates: 70
Its data table
| Feature | From | To | From Lon | From Lat | To Lon | To Lat | Crates |
|---|---|---|---|---|---|---|---|
| Feature 1 | Carrow | Ashford | 5 | 5 | 5 | 15 | 30 |
| Feature 2 | Carrow | Dunmore | 5 | 5 | 15 | 5 | 12 |
| Feature 3 | Ashford | Brook | 5 | 15 | 15 | 15 | 20 |
| Feature 4 | Dunmore | Brook | 15 | 5 | 15 | 15 | 8 |
Certification covers charts only: it measures the chart's specification. A pass means no offered rule found a problem, not a general promise. An ECharts type certifies only when its data is supplied.
The call
{
  "brand": "A",
  "theme": "light",
  "spec": { … the normalized spec viz_render returned … },
  "data": { … the same data it drew … }
}