Charts / Heatmap
Heatmap
Rendered from sample rows by viz_render in OODS Foundry 0.10.1, in each theme.
Generated from @oods/foundry 0.10.1
Each chart is drawn live in your browser from the spec viz_render returned with it, so you can point at its marks. The SVG viz_render returned is the record: its hash is under each chart, and it shows where a live drawing would differ from it.
pattern:viz:correlation-matrix
sha256:de6a32e63147… drawn live from its spec 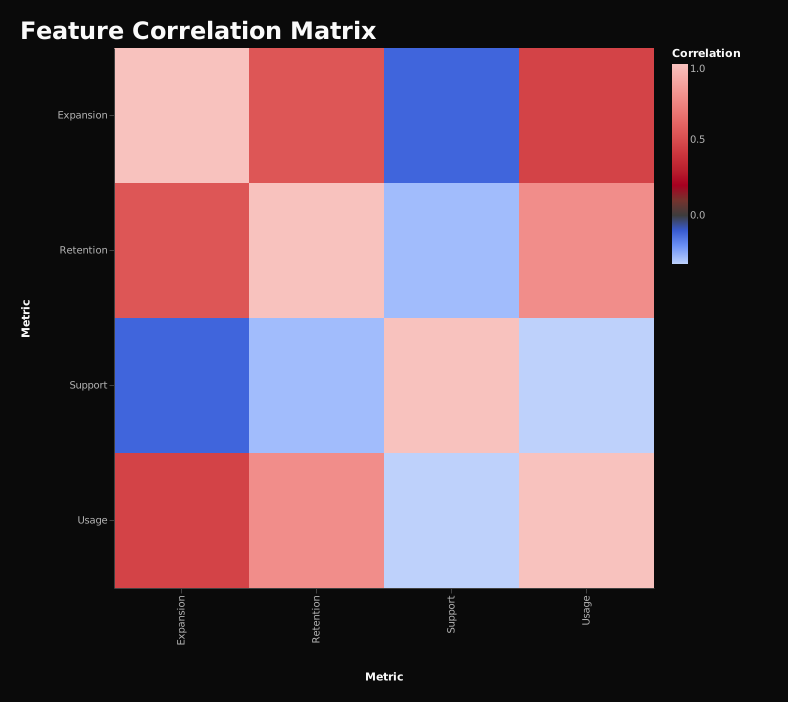
sha256:5b076b9320f0… drawn live from its spec 
sha256:dc95ce083313… drawn live from its spec pattern:viz:time-grid-heatmap
sha256:6deab9d419bd… drawn live from its spec 
sha256:8bdba04d0168… drawn live from its spec 
sha256:a1d5970861cb… drawn live from its spec Certified: 4 results
artifact_certify on correlation-matrix, drawn in light: coverage certified, conformant
true.
- accessibility equivalence
a11yEquivalence -
pass - determinism
determinism -
pass - contrast
contrast -
unchecked - accuracy
accuracy -
pass
Contrast: No gradeable OODS series paint: the compiled spec has no color encoding or OODS mark color, or none of its series paints rendered — author-decorative colors are skipped as chrome. certify grades the series-to-paint assignment of the rendered chart (the compiled spec rendered through @oods/viz-render), against the requested CSS scope canvas. Scope: light/A.
Its narrative
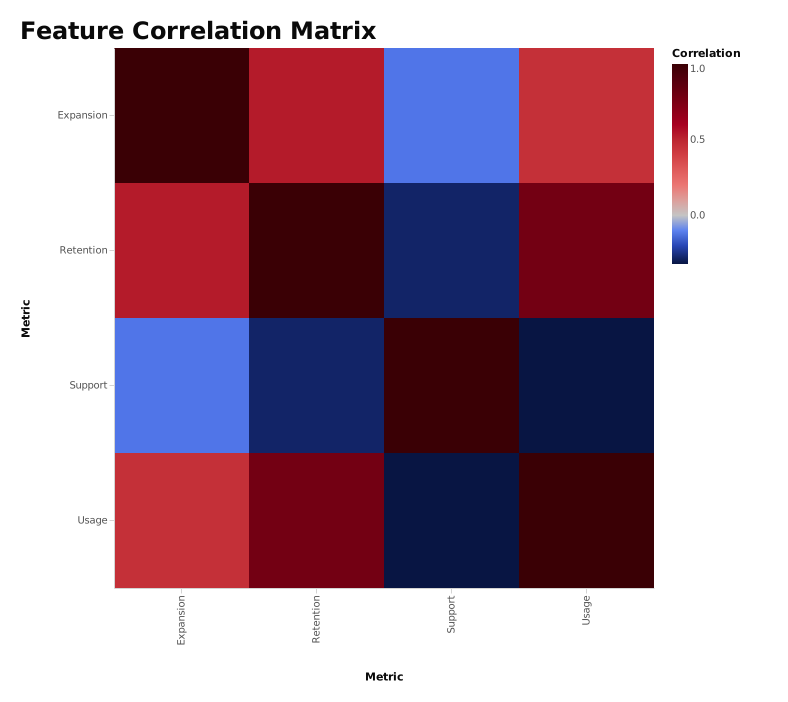
Expansion tracks with usage/retention, support ticket volume is the only negative driver.
- Usage↔Retention correlation = 0.78
- Support inverse relationship is strongest vs usage
Its data table
| Metric | Metric | Correlation |
|---|---|---|
| Usage | Usage | 1 |
| Usage | Retention | 0.78 |
| Usage | Expansion | 0.46 |
| Usage | Support | -0.32 |
| Retention | Usage | 0.78 |
| Retention | Retention | 1 |
| Retention | Expansion | 0.54 |
| Retention | Support | -0.28 |
| Expansion | Usage | 0.46 |
| Expansion | Retention | 0.54 |
| Expansion | Expansion | 1 |
| Expansion | Support | -0.12 |
| Support | Usage | -0.32 |
| Support | Retention | -0.28 |
| Support | Expansion | -0.12 |
| Support | Support | 1 |
Certification covers charts only: it measures the chart's specification. A pass means no offered rule found a problem, not a general promise. An ECharts type certifies only when its data is supplied.
The call
{
  "brand": "A",
  "theme": "light",
  "spec": { … the normalized spec viz_render returned … }
}